Grayscale’s Inclusion Sparks 10% JUP Price Surge, Uptrend Holds

Jupiter (JUP) price recently surged over 10% following news that Grayscale added the coin to its list of 35 altcoins under consideration for investment. This positive development has driven renewed interest in JUP, sparking an uptrend in the market.
While some metrics point to continued strength, others suggest that the uptrend may face challenges ahead. Let’s explore these indicators to understand what might be next for JUP.
JUP Current Uptrend Is Very Strong
The recent news from Grayscale has resulted in JUP’s Average Directional Index (ADX) jumping to 39.76. The ADX is a measure of trend strength, with values above 25 typically indicating a strong trend in the market.
In this case, a value near 40 is substantial and signifies that the current price trend has significant momentum. Importantly, ADX itself does not indicate the direction of the trend — it simply shows how strong it is.

Given the recent upward price action and the ADX value, it is clear that the trend pushing JUP higher is gathering force. Such an ADX reading gives traders confidence that the trend is not weakening, suggesting that the recent surge may continue.
Read more: 11 Top Solana Meme Coins to Watch in October 2024
When analyzing the Directional Movement Index (DMI) chart for JUP, the D+ line stands at 37.99, while the D- is at 10.69. The DMI consists of two components, the positive directional indicator (D+) and the negative directional indicator (D-), which help in identifying whether buyers or sellers have the upper hand.
In JUP’s case, a D+ of 37.99 compared to a D- of 10.69 shows that buyers are dominating the market. A higher D+ means that upward pressure significantly outweighs downward pressure, reflecting strong bullish sentiment. The combination of a high ADX value and the considerable difference between D+ and D- suggests that the current uptrend is strong and likely to persist.
This setup indicates that JUP has the potential for further price growth, as buyers maintain a solid advantage over sellers, driving continued positive momentum.
This Metric Shows The Party Could Be Over Soon
On the other hand, JUP’s BBTrend is currently at 3.38, reflecting a relatively subdued level of momentum compared to recent highs. The BBTrend indicator has been hovering around this value for the last few days, showing a significant drop from the level of 13 that it reached at the end of September when JUP experienced a price spike.
This decline suggests that while the current price movement is positive, it may lack the intensity seen during the previous rally. The contrast between the current BBTrend reading and the peak in late September reveals that momentum has somewhat cooled off since the earlier spike, indicating a potential weakening in bullish strength.
BBTrend, or Bollinger Bands Trend, is a metric used to gauge the strength and direction of price movements in relation to the Bollinger Bands. It essentially measures the price’s position relative to the band and can indicate whether an asset is experiencing a strong trend or volatility.
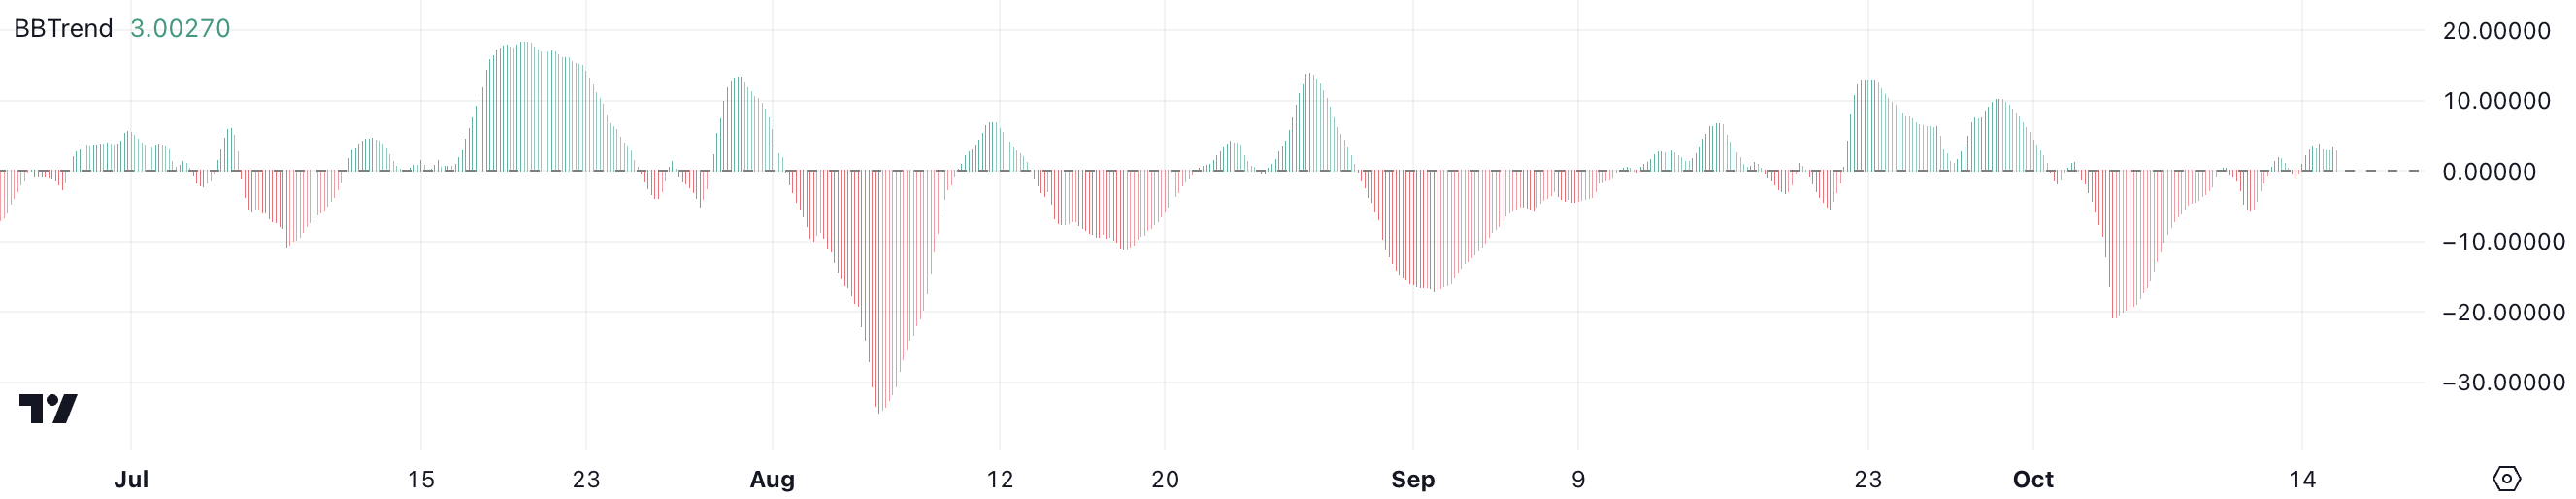
A higher BBTrend value suggests that the price is actively moving toward the outer bands, implying strong momentum and significant price volatility.
Although the Directional Movement Index (DMI) and ADX indicate that the current uptrend is strong for JUP, the relatively low BBTrend value raises questions about the sustainability of this trend. It hints that while the price direction is decisively upward, the volume and overall market enthusiasm may not be sufficient to maintain the same level of strength going forward.
This divergence between strong trend indicators and a moderate BBTrend suggests that the current trend could face challenges, especially if the buying volume does not pick up.
JUP Price Prediction: Is It Set To Be Back to $1.22 Soon?
JUP’s shorter Exponential Moving Average (EMA) lines have recently crossed above the longer-term EMA lines, which is often considered a bullish signal. This type of crossover indicates a shift in momentum where recent price movements are outpacing the average price over a longer period, suggesting that buyers are stepping in and gaining strength.
However, one short-term EMA line is still attempting to cross above the longer-term ones, indicating that while the bullish trend is forming, it has not yet fully matured. The full crossover of all short-term EMA lines above the longer-term ones would further solidify the bullish sentiment and confirm the presence of a strong upward trend.
Read more: Solana ETF Explained: What It Is and How It Works
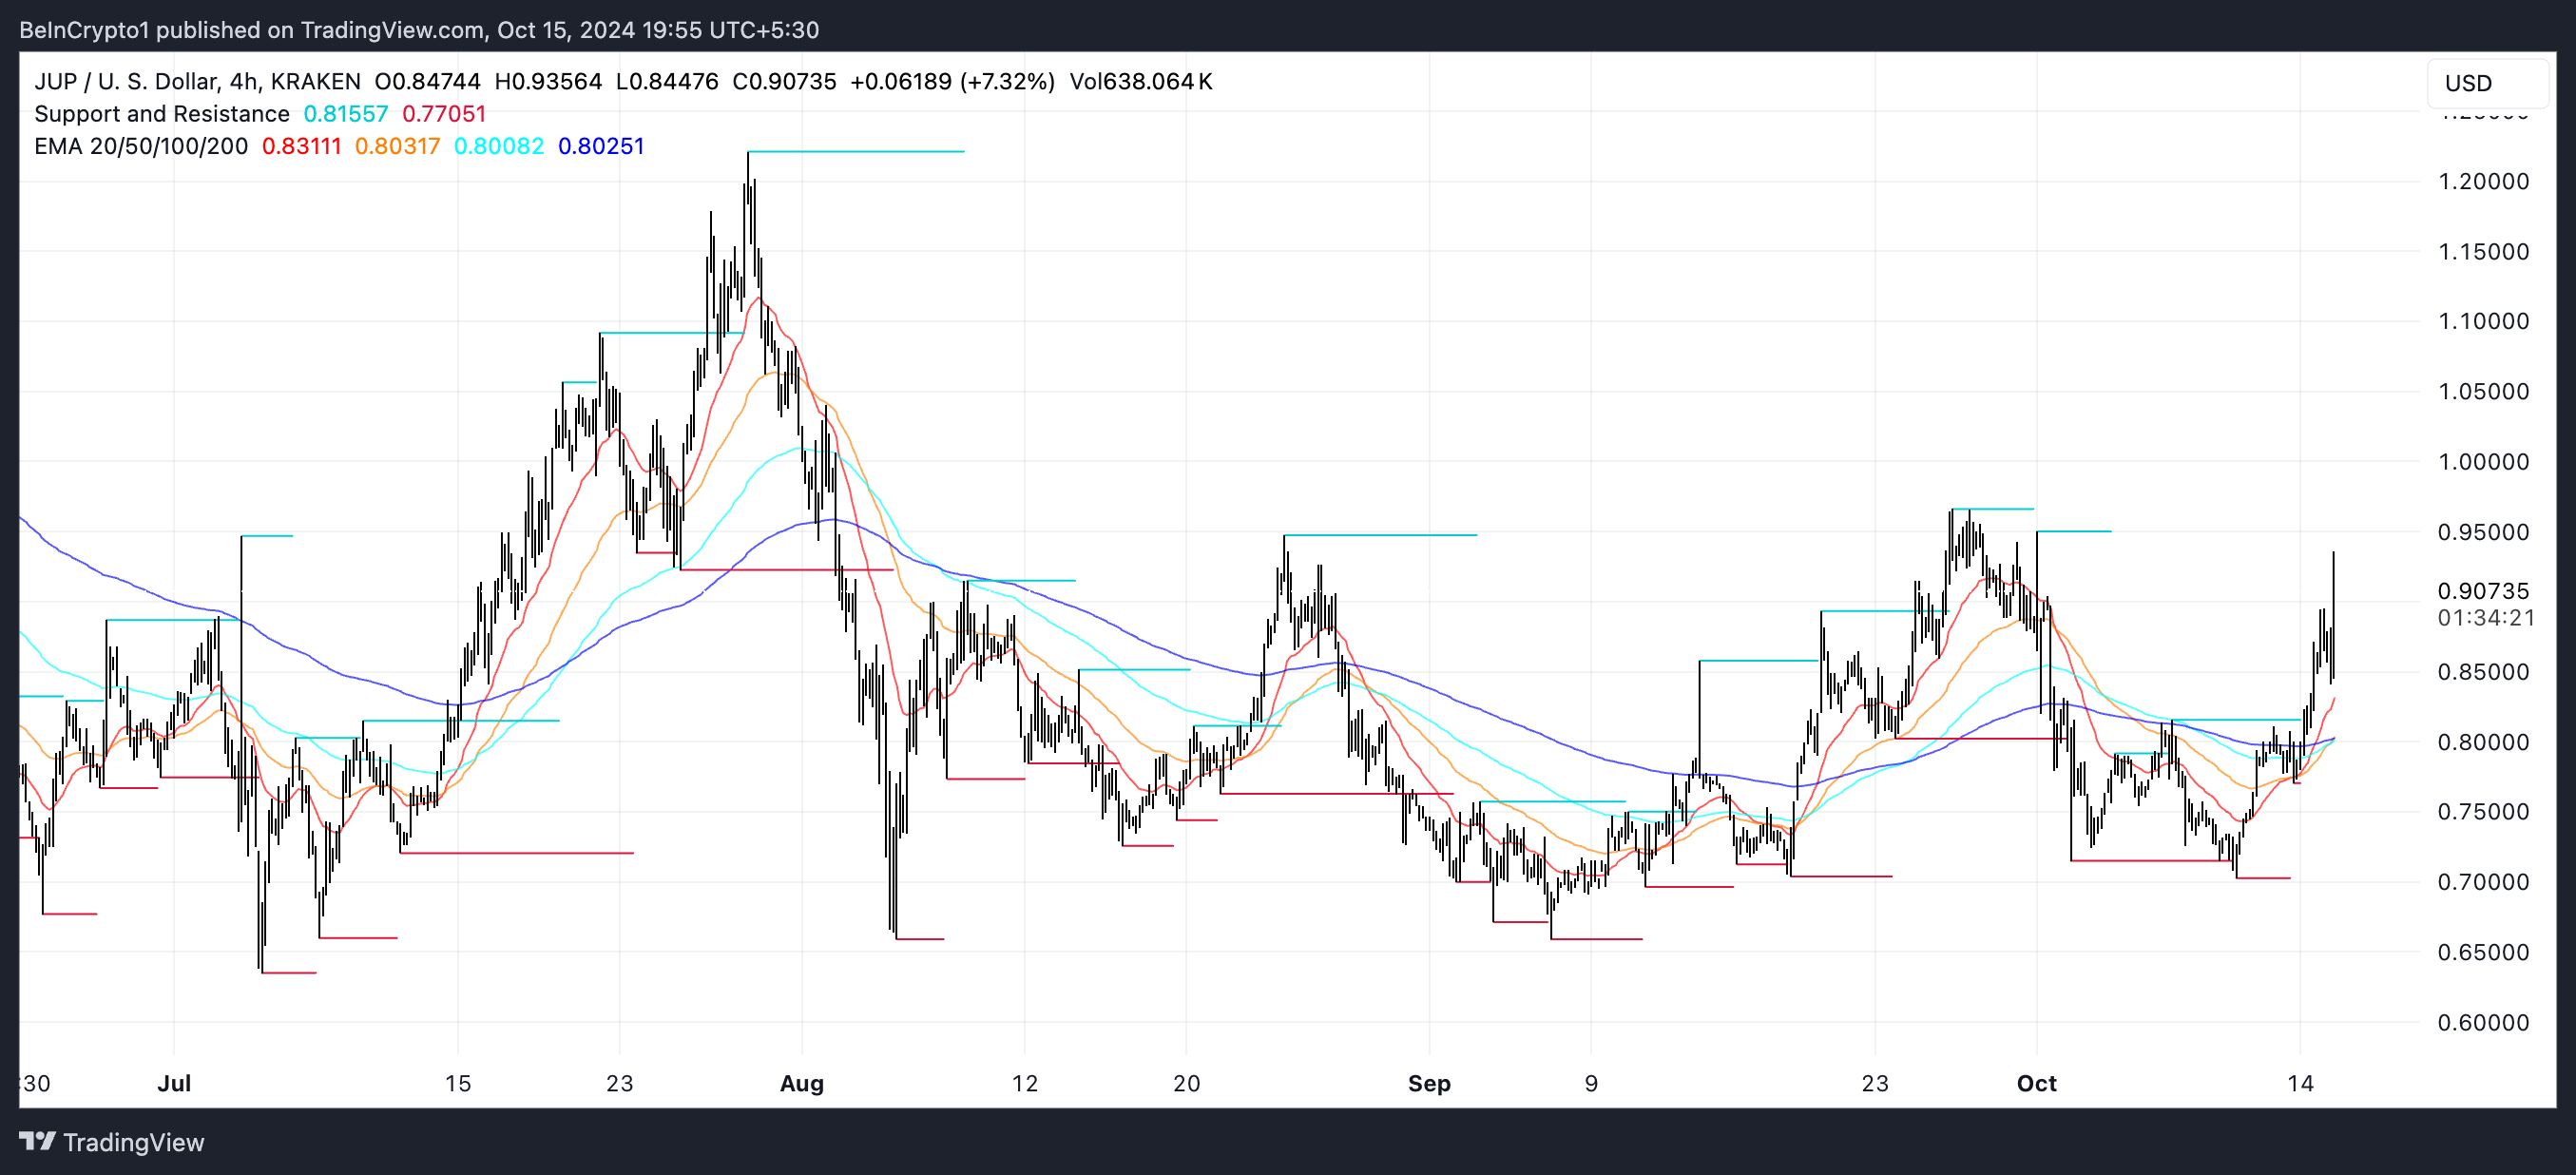
EMA lines are a type of moving average that gives more weight to recent price data, making them particularly responsive to the latest price changes. Traders often use EMA crossovers to identify shifts in market trends. When shorter EMAs cross above longer ones, it is typically interpreted as a signal that momentum is turning positive and a potential rally could be on the way.
If JUP’s remaining short-term EMA line also crosses above the long-term lines, it would likely strengthen the existing uptrend, paving the way for JUP to test key resistance levels at $0.96 and $1. Should the momentum be strong enough, JUP price could potentially target $1.22, which would represent a substantial 38% price surge.
Disclaimer
In line with the Trust Project guidelines, this price analysis article is for informational purposes only and should not be considered financial or investment advice. BeInCrypto is committed to accurate, unbiased reporting, but market conditions are subject to change without notice. Always conduct your own research and consult with a professional before making any financial decisions. Please note that our Terms and Conditions, Privacy Policy, and Disclaimers have been updated.