ETH/BTC hits lowest point in over 3 years, sliding to 0.03508

Key Takeaways
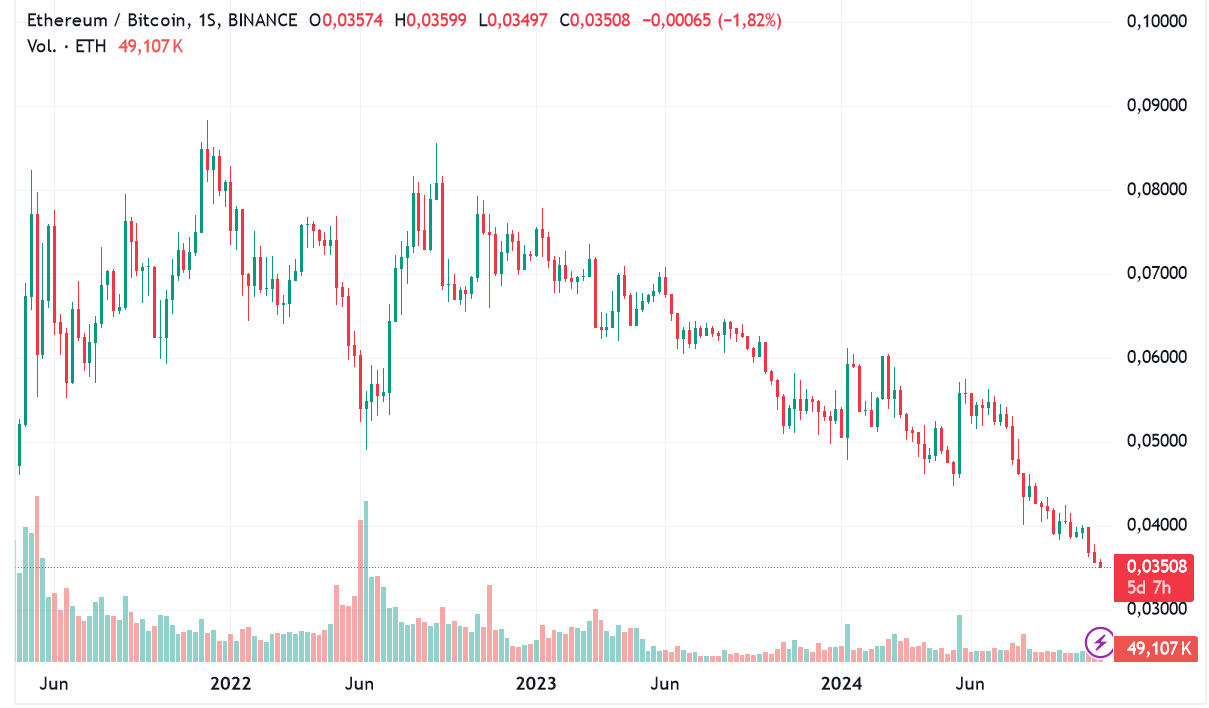
ETH/BTC trading pair has reached its lowest level in over three years, falling to 0.03508.
Historical patterns suggest that Ethereum may experience further declines against Bitcoin.
Share this article
Ethereum’s valuation against Bitcoin (ETH/BTC) has reached a new low of 0.03508, at the time of writing, marking its lowest level since April 2021.


This decline to a 3.5-year low has intensified discussions around Ethereum’s market cycle and its potential approach to its lower logarithmic regression trend line that has historically provided support during bearish phases.
Analyst Benjamin Cowen suggests that ETH could reach this level in the coming weeks before 2025, as part of a broader cycle reset.
This low aligns with patterns observed in 2016 and 2019, where Ethereum experienced significant drops before finding stability and rebounding.
Despite previous optimism surrounding the merge and several ETFs approvals, Ethereum’s valuation against Bitcoin has steadily declined, following a trajectory that echoes past cycles.
Analysts suggest that if this level is reached, it could provide a foundation for consolidation before a more durable uptrend begins.
The 50-day simple moving average (SMA) for ETH/BTC, is being closely watched as an indicator of a potential bottom.
Historically, when ETH/BTC crosses above this level, it has signaled a possible trend reversal, making it a key level to watch in the coming weeks.
With ETH/BTC at its lowest point in years, Ethereum holders may consider hedging as it approaches this regression line.
Bitcoin’s growing market dominance is another factor impacting Ethereum and other altcoins, which have shown continued weakness relative to Bitcoin.
Analyst Benjamin Cowen emphasizes that Ethereum might reach a low around $1,500, based on indicators from previous cycles when Ethereum approached its lower regression trend line.
Share this article


